Updated August 2023: 5 Traits Corporate Sponsors Look For in Sports Partners
It’s already been a week in the wild world of sports and it’s only Wednesday. US soccer fans started out...


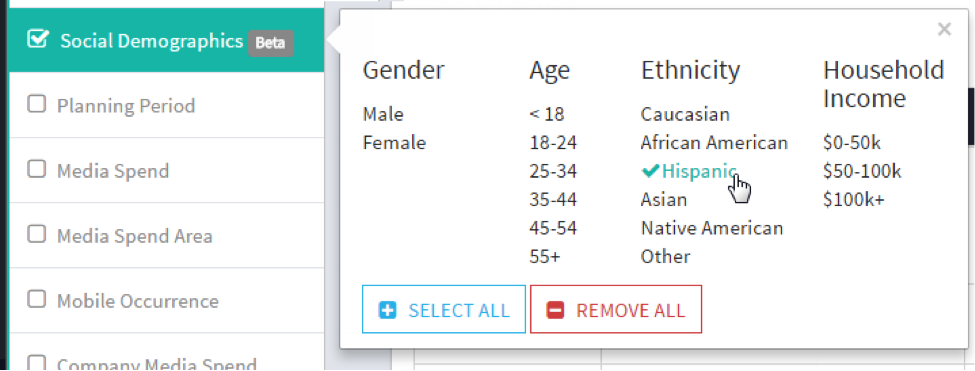
All advertisers are not created equal. Some brands appeal more strongly to Hispanics, or Millennials, others skew male, trend affluent, or any combination of the above. And now, Winmo users can discover advertisers’ unique audience compositions, thanks to our growing partnership with StatSocial, which analyzes the social footprint of thousands of brands to capture the essence of their demography.
Furthering on our Statsocial integration from 2 years ago, Winmo is now adding demographic data to over 5,000 Winmo profiles (formerly 2,000 profiles). Customers will now have the ability to track social audience intelligence and find insights across segments like:
Use Cases: How Winmo Clients Are Benefiting from StatSocial Data
Ad agencies, publishers and sponsorship sellers are using this feature to isolate prospects most likely to be interested in their offerings. Lifestyle-focused organizations, for instance, can target brands with a higher-than-average household income rank. Many sales teams are using the filters to reach advertisers whose audiences correspond with their own viewership, while others are flipping the model to focus on brands not currently attracting their core segment, in order to expose growth opportunities.
Let’s say you want to reach the decision makers at Skittles for example. The StatSocial audience report gives a full breakout of the characteristics of Skittles’ social media followers. In the video attached below, you will see color bars identifying each trait as well as an index.

Color Bars:
Each bar shows the portion of Skittles’ following in that particular demographic. For example, we can see that almost half (47%) of Skittle’s audiences comes from households making between $50K-$100K per year. Keep in mind the more dark blue a color bar becomes, the more above average that particular demographic percentage is.
Index:
Another way to interpret StatSocail data is the index for each trait. The index simply defines how much above or below average each reading is. An index of 100 means exactly average. For our the sake of our Skittles example, we can see that the age group of 18-24 has an index of 151. In layman’s terms, the population of Skittles’ social followers between the ages of 18-24 is 151% of what would be considered average.
For maximum prospecting value, sales and new business teams also have the ability to hone in on social segments in searches, to build out hyper-targeted prospect lists.
Whether or not a sales organization caters to a particular audience, they can utilize social demographic data to personalize outreach and craft a more powerful and comprehensive needs analysis.
Ready to start filtering your prospect lists based on social demographic data? Request a Winmo trial today!